Data lineage and workflow documentation in visual data exploration
Doctoral Researcher:
Armin Bernstetter, GEOMAR and CAU Kiel, abernstetter@geomar.de
Supervisors:
- Dr. Tom Kwasnitschka, Head of Seafloor Visualization Group, GEOMAR Helmholtz Centre for Ocean Research, twkasnitschka@geomar.de
- Prof. Dr. Isabella Peters, Head of Group Web Science, CAU Kiel, ipe@informatik.uni-kiel.de
Location: Kiel
Disciplines: Human-Computer Interaction, Data Visualization, Computer Graphics
Keywords: Provenance, Immersion, Interactive Visualization, Visual Analytics, Visualization Systems and Tools, Open Science
Motivation
We propose the development and empirical evaluation of a software framework to log the lineage of spatially immersive visualization processes, with a particular emphasis on marine geosciences.
Data lineage (or provenance) describes the trace of actions and intermediate products throughout a scientific data processing workflow. It is meant to be an objective, reproducible protocol leading to, and ideally directly supporting, publications.
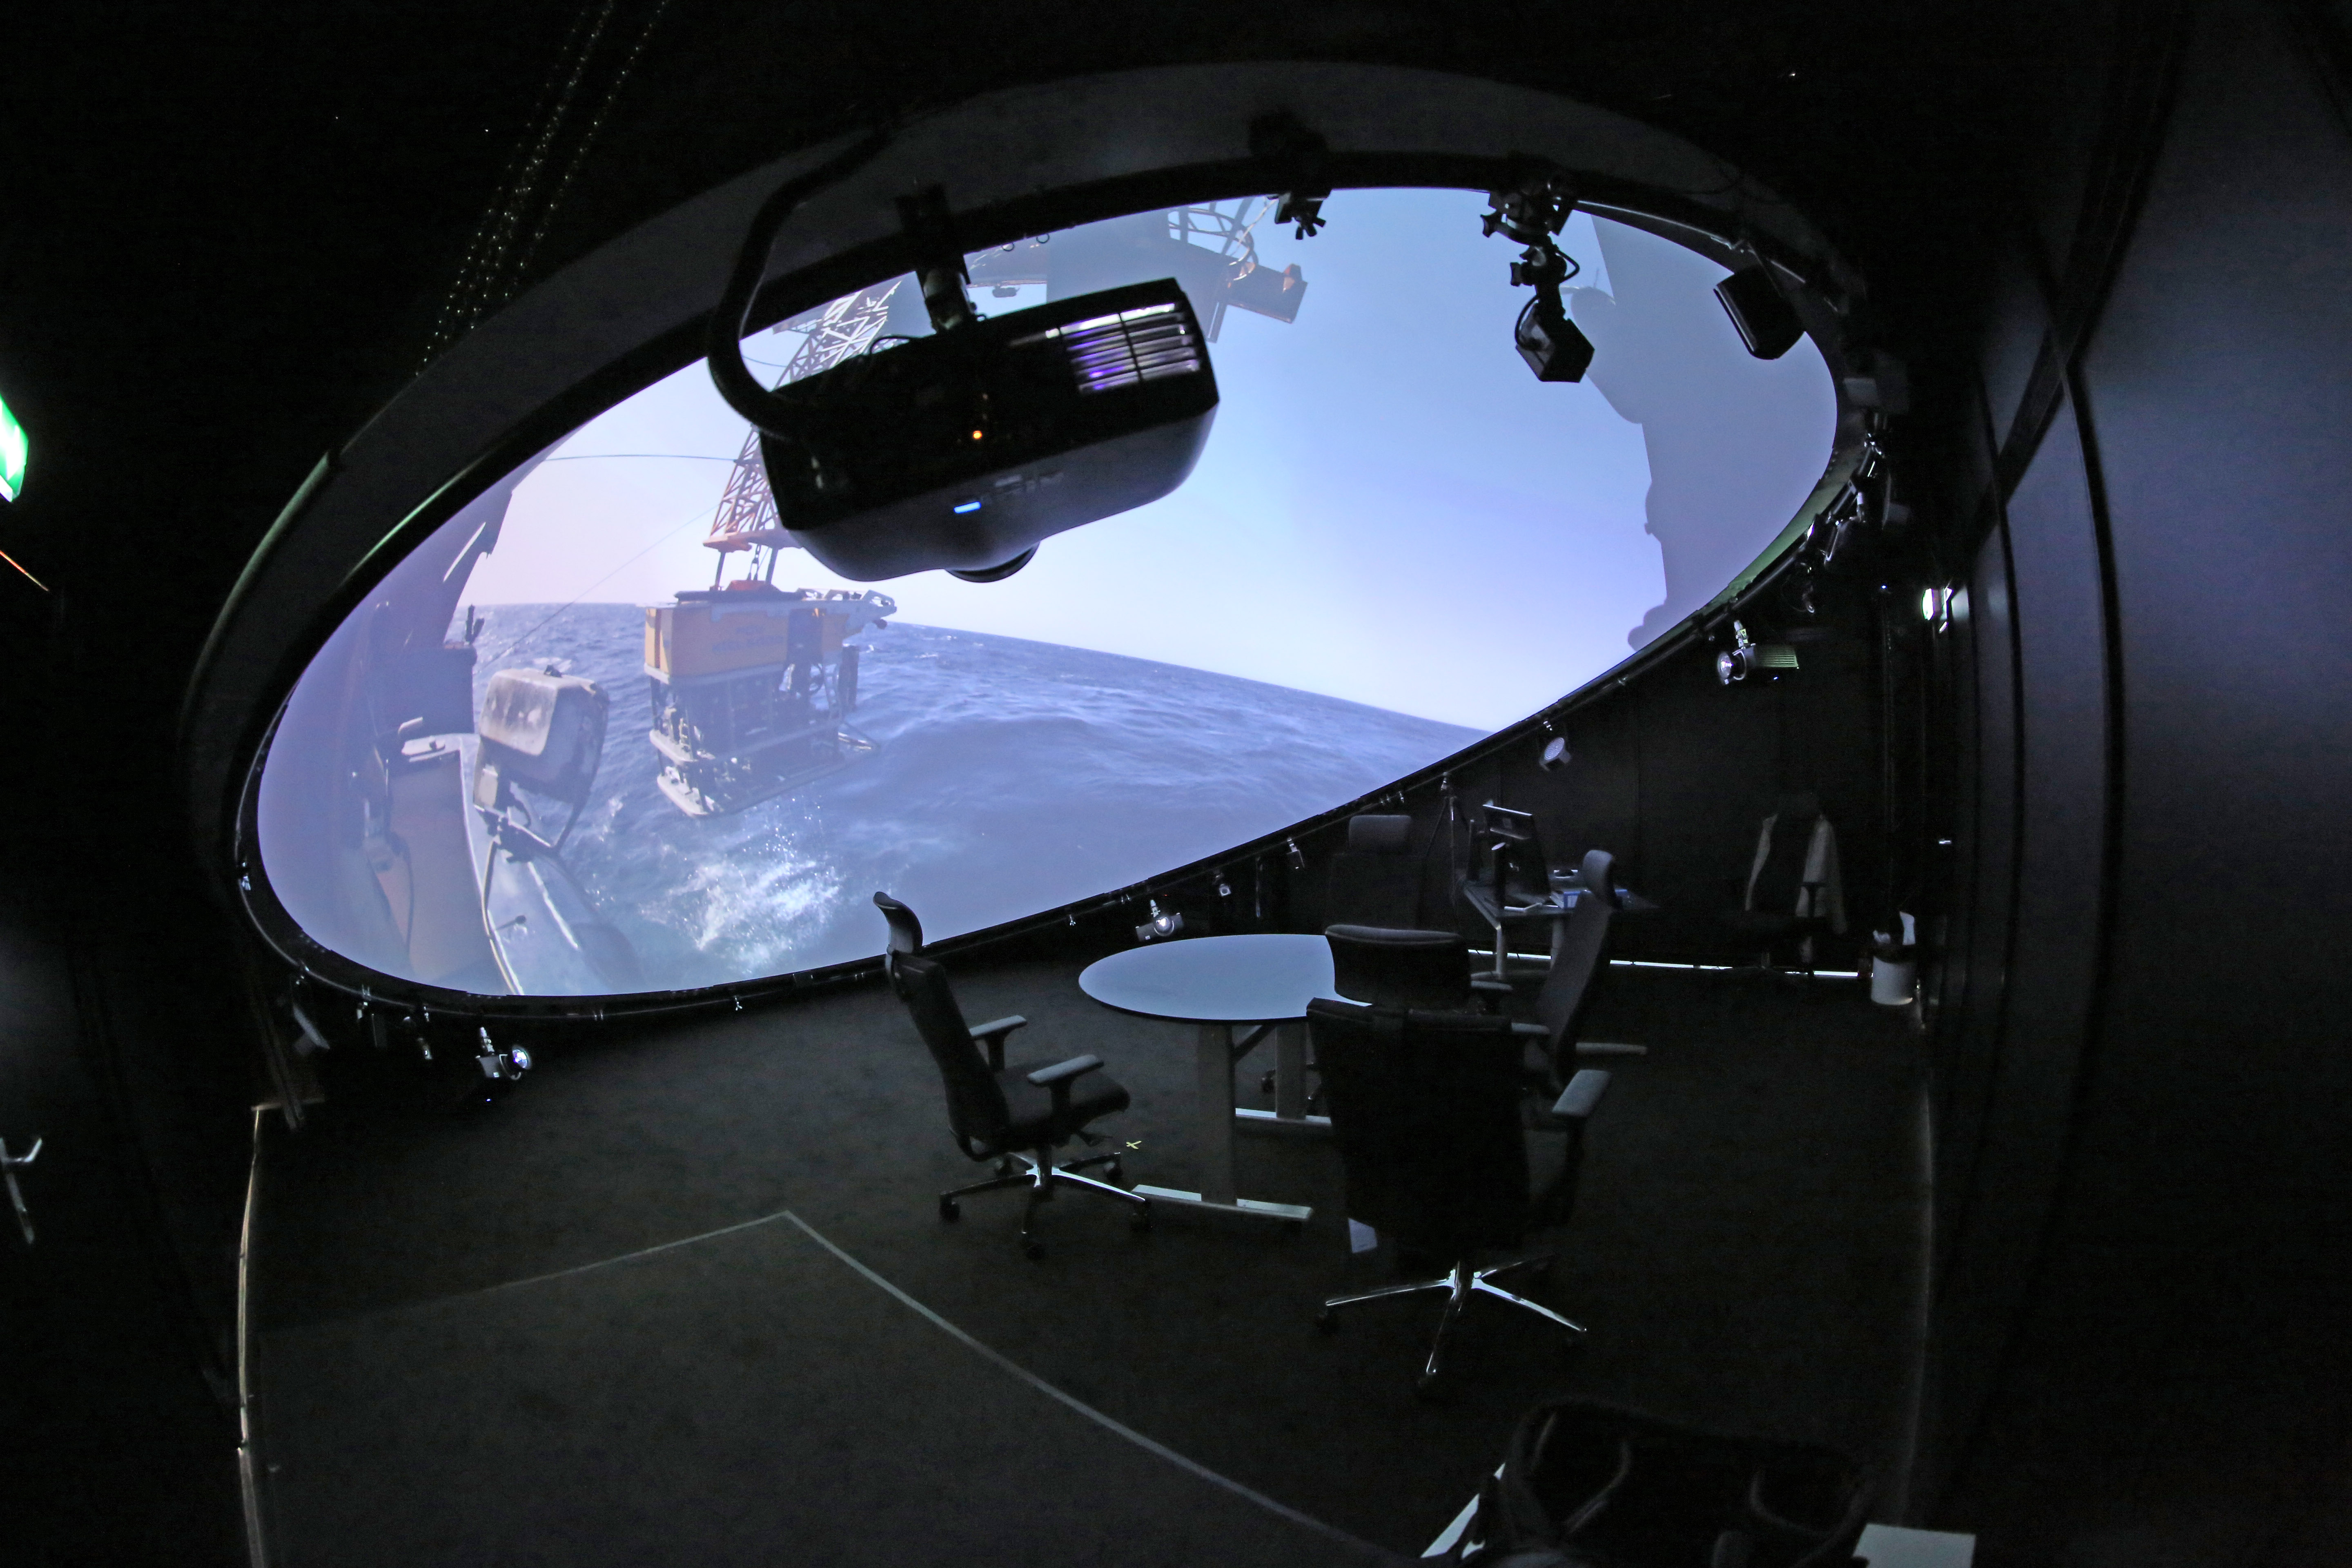
While the concept of data lineage is well established in information and computer science, it still is generally not well implemented in the field of visual data exploration (Callahan et al, 2006), which is criticized as being a volatile discipline without a quantifiable added value. On the other hand, visualization is a key facilitator of marine geosciences, where limited access to the seafloor through remote sensing, robots and submersibles results in sparse-dataset problems, and the personal bias in their interpretation is considerable (van Wijk, 2005). With the [ARENA2] visualization laboratory, the Kiel ocean science community has invested heavily in this field (Kwasnitschka, 2017).
With such a possibility for scientific visualization, the demand for a transparent, reproducible framework for the logging and publishing of ocean science visualization processes is considerable.
Aim
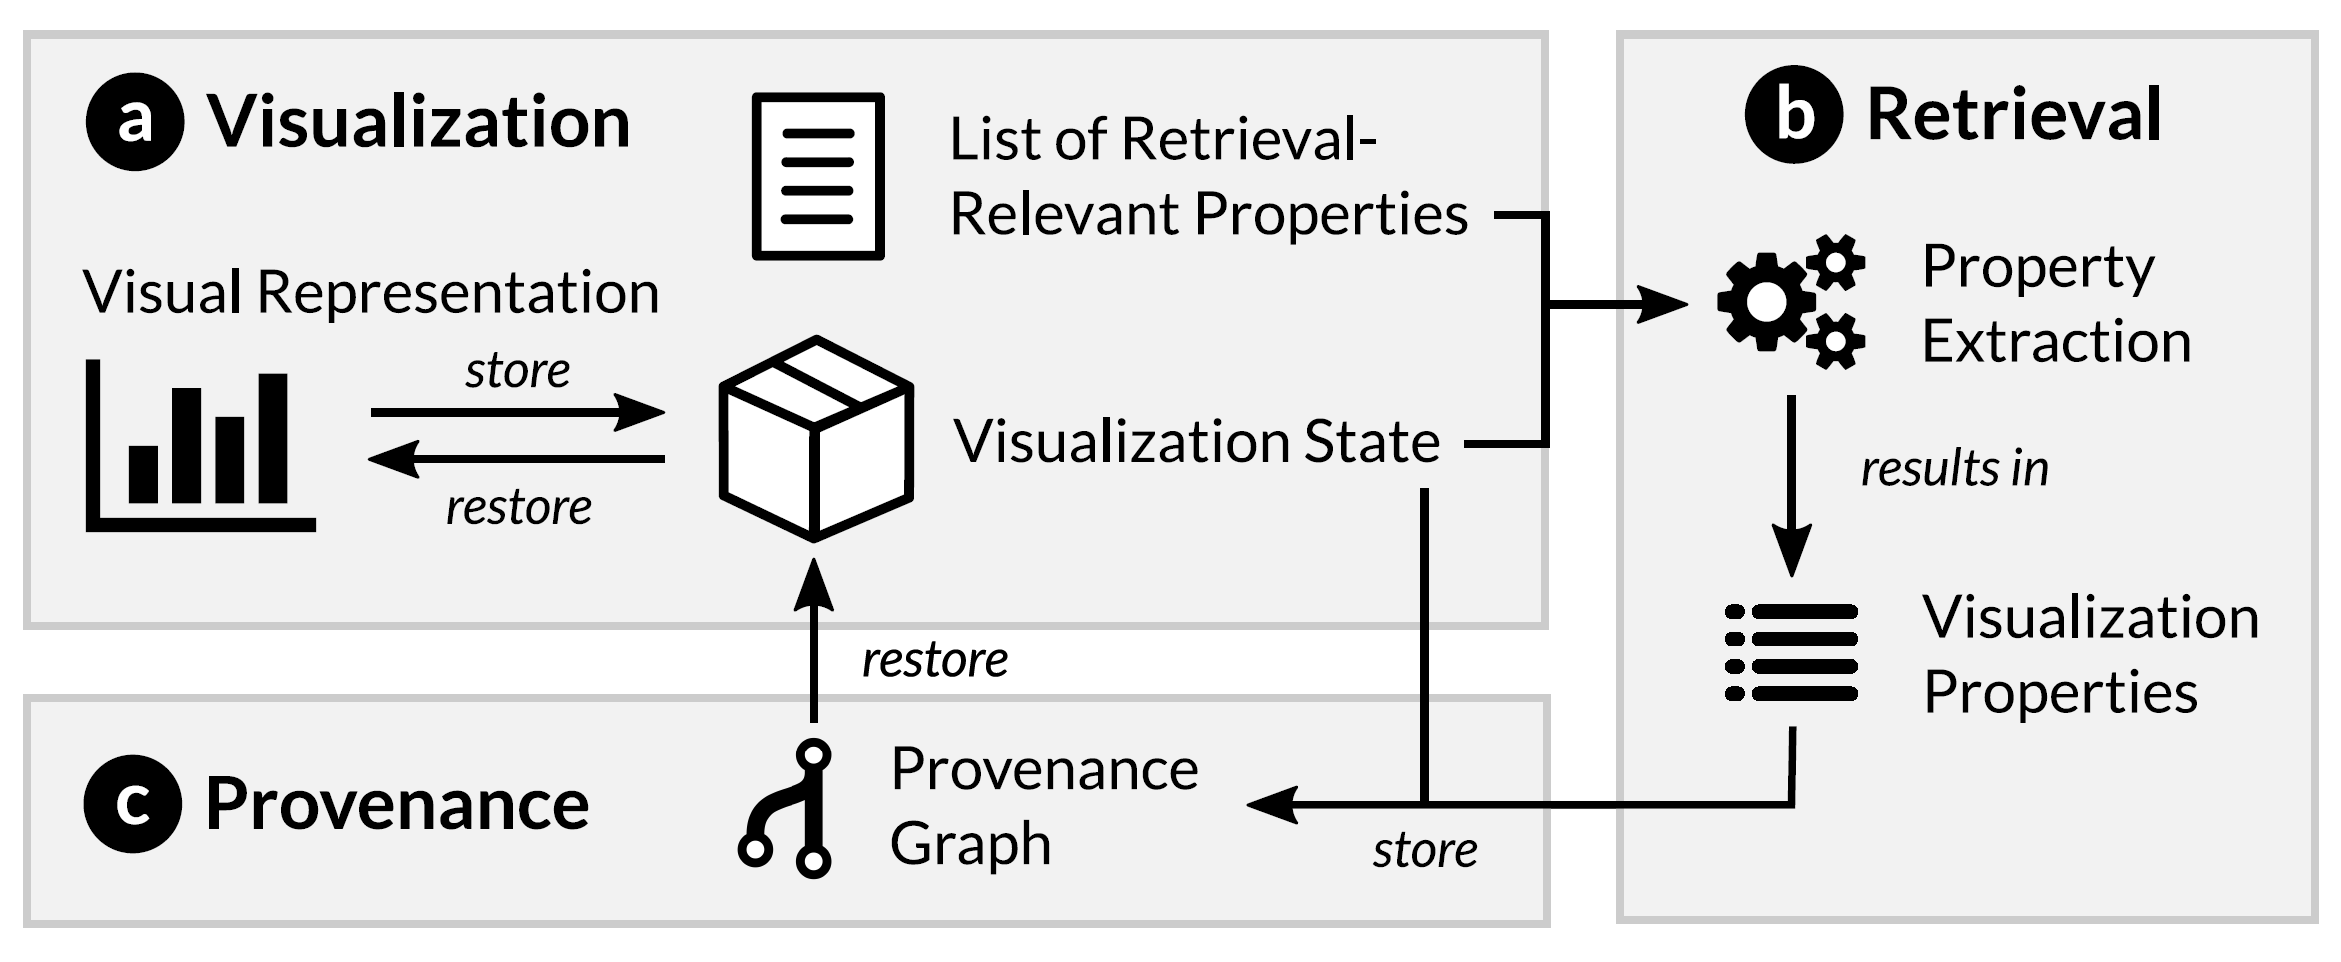
Such a Provenance Visualization and Management Tool (PVMT) or framework needs to be able to log users' interactions with a visualization application and itself visualize the interaction history e.g. as a graph or tree. From this history, past visualization states shall be retrievable and it shall be possible to re-apply these states to the visualization software at hand. This supports replicability and collaboration in visual analytics workflows because others can better follow thought processes and steps that were taken before arriving at a conclusion or epiphany.
The PVMT shall support the development of parallel, alternative “what-if” processing scenarios (branching) and be generally applicable to a wide range of scientific data processing workflows. Initially, however, it will focus on a set of applications available in the ARENA2.
As the framework is developed with the support for domain scientists in mind, its evaluation is set to be done through user studies involving scientific professionals and students.
Initial Tasks
1. Identification of provenance artifacts in immersive data visualization/visual analytics workflows
2. Implementation of a provenance visualization and management tool/framework
3. Evaluation of this tool/framework in user studies
References
- Callahan, Steven P., Juliana Freire, Emanuele Santos, Carlos Eduardo Scheidegger, Cláudio T. Silva, and Huy T. Vo. 2006. “VisTrails: Visualization Meets Data Management.” In SIGMOD Conference, edited by Surajit Chaudhuri, Vagelis Hristidis, and Neoklis Polyzotis, 745–47. ACM. doi:10.1145/1142473.1142574.
- Kwasnitschka, Tom. 2017. “Planetariums—Not Just for Kids.” Nature News 544 (7651): 395. doi:10.1038/544395a.
- Stitz, Holger, Samuel Gratzl, Harald Piringer, Thomas Zichner, and Marc Streit. 2018. “KnowledgePearls: Provenance-Based Visualization Retrieval.” IEEE Transactions on Visualization and Computer Graphics (VAST ’18) 25 (1): 120–30. doi:10.1109/TVCG.2018.2865024.
- Wijk, Jarke J. van. 2005. “The Value of Visualization.” In IEEE Visualization, 79–86. IEEE Computer Society. doi:10.1109/VISUAL.2005.1532781.