Deciphering Fram Strait’s Organic Matter Dynamics from Spectral High Resolution Data
Doctoral Researcher:
Nils Müller, AWI and Bremen University, nils.mueller@awi.de
Supervisors:
- Prof. Astrid Bracher, AWI
- Prof. Thorsten Dickhaus, Bremen University
Location: Bremerhaven
Disciplines: physical oceanography, time series analysis, data engineering
Keywords: colored dissolved organic matter, Fram Strait, hyperspectral measurements, time series uncertainty estimation, data fusion
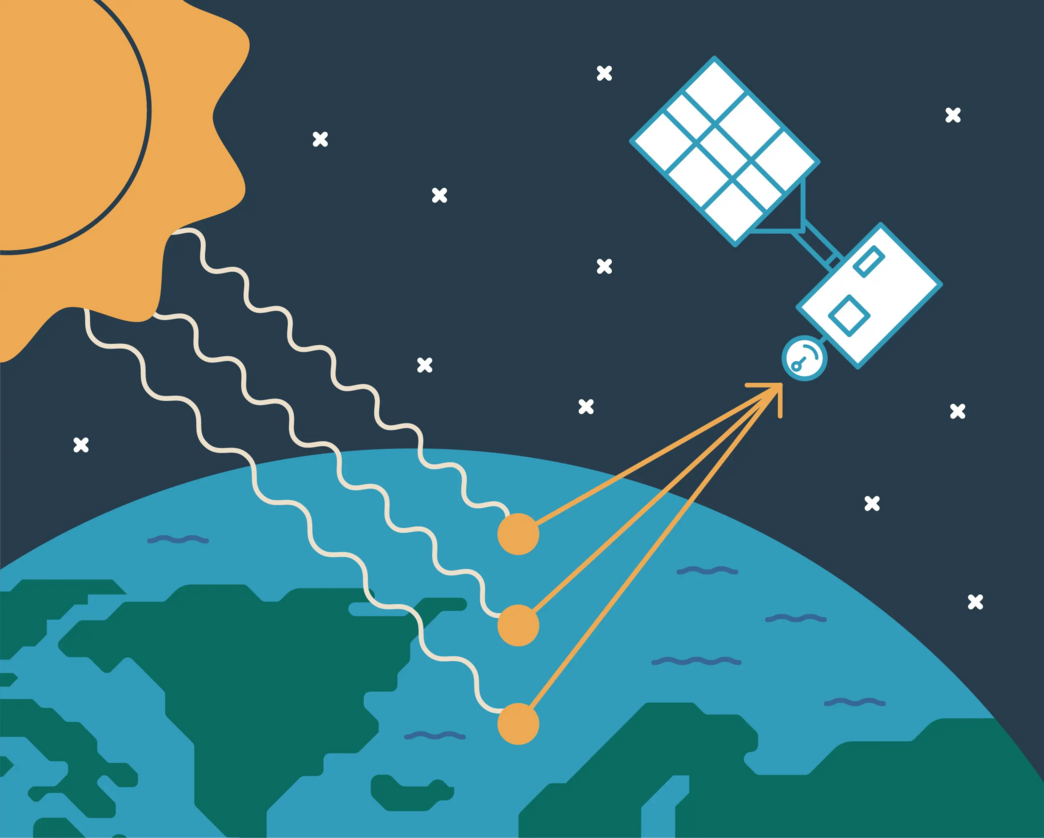
Motivation: Rivers flowing into the Arctic carry large amounts of organic matter, and therefore organic carbon, into the world's oceans. In this project, we are interested in a fraction of the total organic matter called colored dissolved organic matter (CDOM). The name implies that CDOM consists of tiny particles that are part of the liquid itself and that these particles absorb visible and UV light. The latter has a significant effect on the aquatic ecosystems: on the one hand, it limits the light that is available for photosynthesis, potentially limiting primary production. On the other hand, it protects sensitive organisms from harmful ultraviolet radiation. Furthermore, CDOM is interesting because it serves as a proxy for the total dissolved organic matter, which then provides insights on the carbon budget of the oceans. We can measure the CDOM concentration through remote-sensing satellite observations or using in-situ (on-site) measurements collected during ship expeditions. The available datasets are large, have been captured at different times, under different environmental conditions, and come from a variety of measurement devices. However, perhaps the biggest challenge arises from the episodic nature of the data; ship expeditions only take place about once per year, while remote sensing observations rely on clear-sky observations and are limited to the orbit of the satellite. Therefore, we must estimate data in places and at times at which we did not measure any.
Aim: The aim of this project is to compare, harmonize, and validate the available measurements from which we can extract information about the amount of CDOM in the ocean. In the end, we would like to provide a single high-resolution dataset that grows with future measurements. Ideally, it should provide CDOM estimates in regular time intervals at the desired location. First and foremost, this new data format makes the data significantly more accessible. Additionally, because we mitigate the limitations of individual techniques, our CDOM estimates become more powerful than those of any single data source.
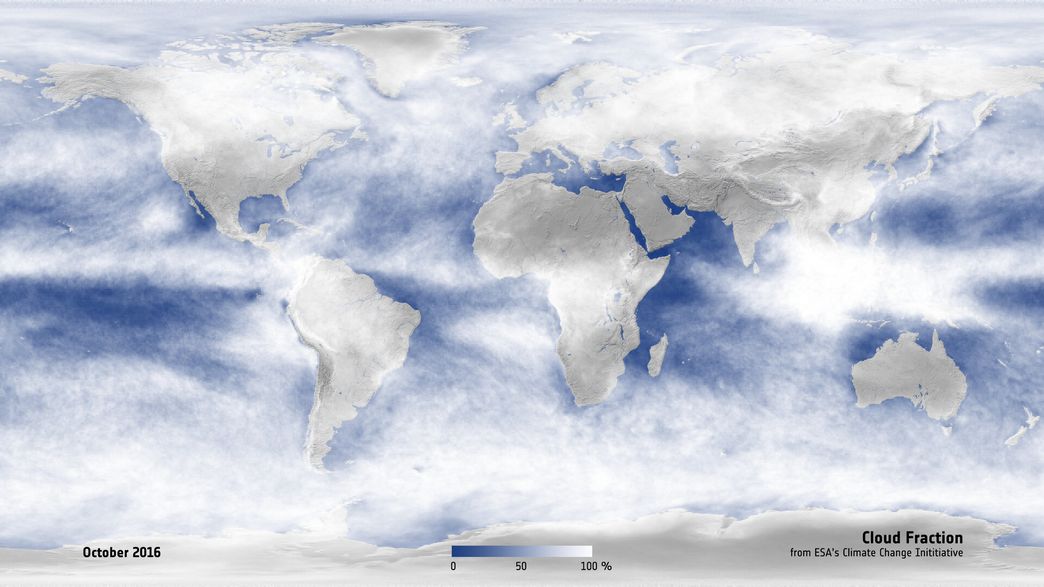
Methodology:The objective we have set for this project places us in an interdisciplinary context: to succeed, we must apply and, when necessary, develop the appropriate statistical methods, establish a novel data processing pipeline, and validate the results using the knowledge of the field, independent measurements, and possibly simulations. Our fundamental building blocks are the source datasets. For the in-situ data, we consider over ten years of ship expeditions from the research vessel Polarstern in the Fram Strait, the only deep-water passage between the Atlantic Ocean and the Arctic Ocean. It is located in between Greenland and northern Norway and has partially ice-free conditions in the summer. During a given expedition, measurements are taken at regular intervals with only occasional gaps. The core instrument is the so-called AC-S sensor, which continuously measures both the absorption and attenuation (absorption + scattering). The other instruments make fewer but more precise measurements; they are used for validation. All instruments work through spectrometry: they separate light components by their wavelengths (colors) and measure their strength. This allows us to infer the concentration of the (optically-active) compounds in the water.For the satellite data, we consider a combination of measurements from the Ocean and Land Colour Imager (OLCI) onboard the Sentinel-3 constellation. It contains not only CCD sensors, which are essentially a conventional camera, but also a spectrometer. It measures the radiance, or strength, of the incoming light at different wavelengths (colors). While the satellite can observe a huge area compared to the in-situ data, the captured light has not only travelled through the water itself (which we care about), but also the entire atmosphere. This can be extremely challenging to correct for, i.e., separate the information of the ocean water from all the other information. In fact, it is frequently impossible because clouds obstruct the view of the surface completely.
To go from these separate datasets, which are irregular in time and space, to a "nice", regular one, we must choose a statistical model that extrapolates, interpolates, and fuses our information. For this, we have essentially two broad avenues: either we use a "conventional" model or we use a neural network-based approach. While the former usually makes more strict assumptions, we usually have a good understanding of its capabilities, potential biases, and limitations; we know how to judge the results. These interpretations are often more challenging with a neural network-based approach, due to the high complexity of these models. Their complexity, however, can offer significant performance gains, i.e., reduced biases, lower noise, and higher accuracy. In summary, to choose our algorithms, we must carefully review the literature, compare, and choose those methods that offer the best performance for our specific problem.